Webinar Notes: The Pulse of Procurement 2015

These notes are from an August 25th webinar hosted by Sourcing Industry Group and presented by Zycus. The two speakers were Ian Hinke, Vice President of Sourcing and Vendor Management at PHH Mortgage, and Richard Waugh, Vice President of Corporate Development at Zycus.
This event showcased the results of Zycus’ annual Pulse of Procurement study. This year, the participants included 400 respondents, 80% of which were from large companies (<$500M in annual revenue) in North America (68%). Three quarters of the respondents were in procurement management positions.
Although most of the questions were the standard ones about performance metrics, maturity, and technology adoption, there were some very interesting findings between the lines…
Top Priority ‘Others’
Although the top procurement objectives were the usual suspects (savings, efficiency, supplier performance management, compliance), Zycus also provided a chart of ‘others’. Assuming most of the responding organizations picked one or two of the usual objectives, that left room for a less common objective as part of their top three. When Zycus combined all of the top ‘other’ objectives, a very interesting picture of procurement emerged: innovation (23%), cash flow (20%), reduced cycle time (20%), revenue growth (18%), market intelligence (13%), global reach (11%), outsourcing (9%), market share growth (8%).
Addressable Spend
One of the webinar attendees submitted a question about half way through about addressable spend. In the resulting discussion, the speakers distinguished between out of scope and non-addressable spend. Out of scope spend is held beyond procurement’s reach and influence (think marketing or legal), while non-addressable spend includes taxes and licensing fees. More interesting is what impact these figures have on procurement’s spend under management performance. Since the percent of spend under management would typically be calculated by dividing total managed spend by either total addressable spend or total in scope spend, the denominator plays an important role and may change over time. If marketing is off limits, and a new CMO is hired which brings that spend back into play, procurement’s SUM percent will decline – at least in the short term – as the total in scope spend increases. Interestingly (and with no connection to my speculation about changes in the SUM denominator), the average spend under management declined by 4% to 53% from 2014 to 2015.
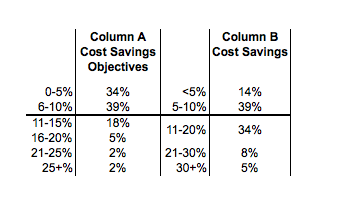
Cost Savings Objectives vs Cost Savings
Since I was fortunate to be viewing the event on demand, I caught the fact that there were two seemingly similar measures of savings in the pulse report and got to back and forth until I figured out the difference. The first, titled Cost Savings Objectives (Column A below), provided a breakdown of what percentage of respondents reported each tier of savings objectives. The second, simply titled Cost Savings (Column B below), categorized the respondents’ actual savings rather than their objectives. If I’m reading the difference in these columns right, procurement is outperforming expectations and objectives overall. Granted, any one organization could fall into a different tier in each column, but while 27% of organizations were expected to realize savings of over 10%, 47% of them actually ended up over that mark.
When you subscribe to the blog, we will send you an e-mail when there are new updates on the site so you wouldn't miss them.