The November 2020 ISM-New York Report on Business: Slowdowns Across the Board

In November, New York City purchasing managers reported that the activity aligned with every index except Prices Paid had slowed down, according to the survey taken by the Institute for Supply Management-New York.
The full report can be downloaded here: ![]() 2020_ISM-New_York_November_ROB_v01.pdf
2020_ISM-New_York_November_ROB_v01.pdf
Report Rundown
Current Business Conditions decreased by 20.9 points from the 18-month high of 65.1 reported in October to a 3-month low of 44.2 in November.
The Six-Month Outlook gave up all of the gains reported in October, falling to a 6-month low of 48.6 in November. We now observe a 7-month continuation of the oscillation between the 40s and the 60s in this index. The six-month outlook has been a reliable short-run guide for current business conditions over time.
Employment, a seasonally adjusted index, was the largest mover in the November report. Employment fell from a 9-month high of 58.4 in October to a 5-month low of 34.6 this month.
Quantity of Purchases fell to a 6-month low of 40.0, down from the 18-month high of 56.7 reported in October.
Top line and forward revenue guidance moved in the same direction in November: down. Current Revenues continued to fall, losing an additional 3.8 points in November to reach 42.9. Expected Revenues also gave back all of the improvement reported in October, falling from a 9 month high of 60.0 to 47.5 in November.
Prices Paid, the only index to show a faster pace of growth this month, rose from a 6-month low of 53.3 in October to 65.0 in November.
Additional Commentary
Obviously, the November Report is a significant pivot from the growth we reported in October. If I had to guess, we are likely seeing a reaction to the resurgence of COVID cases in New York City in this month’s report – especially the 23.8 month over month drop in the Employment index.
The more I look at this month’s numbers, the more I think it all comes down to employment. As I have commented many times in the past, the survey participants are almost exclusively in professional services. Contracts are being pushed out all over the place, which not only means less revenue and uncertain prospects, it may actually mean layoffs. The following figure shows the responses we received for the question about employment.
Employment: Compared to the previous month, how will the number of employees at your company change this month?
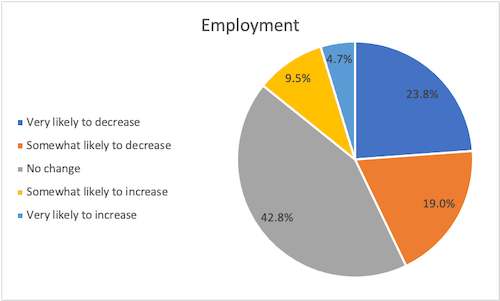
If you look at the breakdown, the same percentage of companies believe that there is likely (or very likely) to be a decrease in headcount as think headcount will remain the same. Only 14.2% think there is any likelihood of an increase. Those are not great odds.
Most of this month’s indices are at 5 or 6-month lows, which puts the overall business conditions back where we were in June/July. It is also interesting that Current Revenues has remained so stable. It has stayed in a 10-point range for the last 5 months, only touching breakeven once, in September, and then returning back to slower growth.
If revenues don’t start to grow, then all of the losses we’ve seen will be absorbed as permanent rather than temporary or reactionary. There are serious questions – especially in the New York Metro area – about professionals remaining, and while local conditions and issues are a concern, we don’t ask where (geographically) the employees will be added. I don’t see this as a relocation to less expensive areas, but rather a reduction that may end up lasting further into 2021 than anyone wants to see.
Please join me on January 5th for the release of the December 2020 ISM-New York Report on Business.
The 2021 Report release schedule is as follows:
January 5
February 2
March 2
April 5 (Good Friday)
May 4
June 2
July 2
August 3
September 2
October 4
November 2
December 2
About the ISM-New York Report on Business
Like ISM’s national report, the ISM-New York Report on Business is compiled as diffusion indices –we add the percent of positive responses to one-half of those responding that conditions remained the same. A reading of 50.0 means no change from the prior month, greater than 50.0 indicates a faster pace of activity, and less than 50.0 a slower rate. Each month is not so much a reading of the current level of activity as it is an indication of growth or contraction from the previous month.
A note specific to the New York Metro area, where all of this report’s respondants are located: they are predominantly in professional services industries. It is important to keep this in mind when we think about the context for the trends being reported by these particular purchasing managers.
When you subscribe to the blog, we will send you an e-mail when there are new updates on the site so you wouldn't miss them.