Chemical Prices Through Pandemic and War

Chemical & Polymer (C&P) prices are volatile due to supply/demand balance and feedstock prices like Crude Oil and Natural Gas, and, most certainly, specific events like the pandemic and geopolitical conflicts will reinforce this volatility.
This article reflects on the changes in price from 2019 to 2022 in the USA, Europe, and Asia, including:
- Organic Chemicals: 105 products like Acetone, Acrylonitrile, Benzene, Cumene, and others
- Inorganic Chemicals: 69 products like Caustic Soda, Carbonates, Sulfates, Phosphates, and others
- Polymers: 30 products like ABS, PET, PE, PP, and others
- Naturals: 14 products like Menthol, Saccharin, Sorbitol, and others
Methodology
I have used price data from Intratec, which publishes monthly Import/Export prices by country. We understand that Import/Export prices are lower than market prices because companies will import products only if the price is lower than the local market price, and producers only export products from their extra capacity at lower prices than market to increase their operating rate.
Even though Import/Export prices are lower than the market, they are good references because they reflect the changes in the market on a monthly basis. Additionally, it is good to know alternative prices for the products one buys locally.
For each group of products listed above, I have calculated the average price by year and region, then calculated the changes (%) year over year. Crude Oil prices have also been included as a reference.
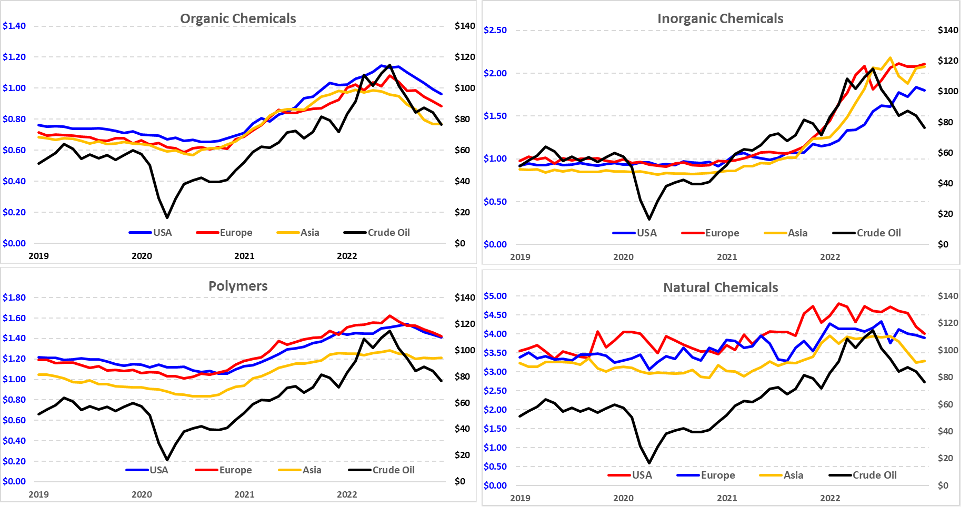
Price Movement
Readers can observe the average price of their region relative to the others. Note the differing price scales for each group. There was a decrease in 2020 in all products except Naturals in the USA; then all prices increased to 2022.
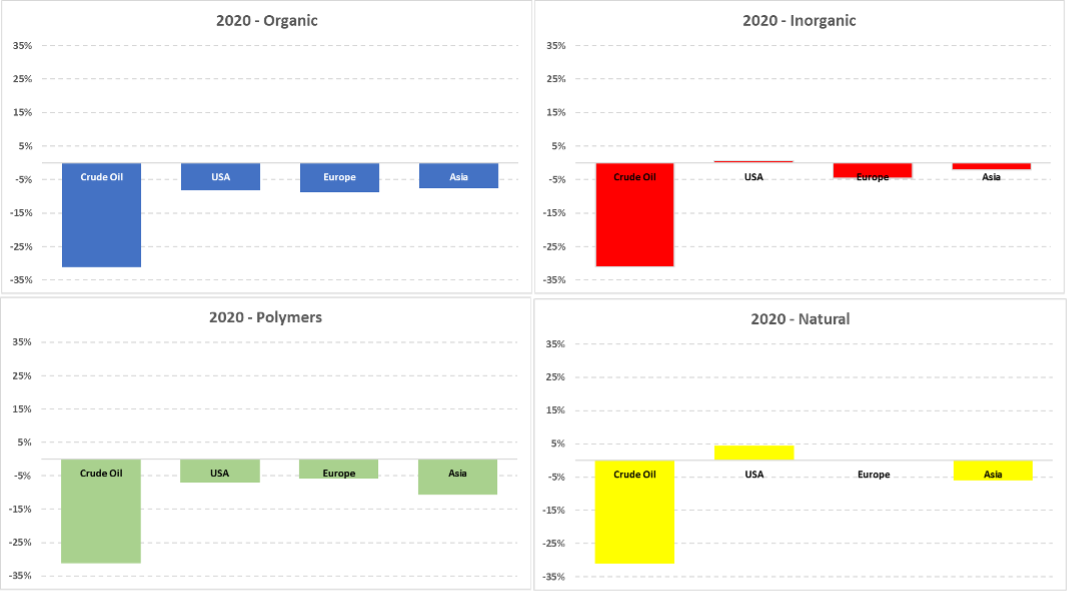
Changes Year Over Year
In my experience, it is better to analyze the above graphs by calculating the changes in percentage compared to previous years.
2020 – The pandemic year showed a very sharp decrease in demand, causing a drop in prices across most regions and products. Only the USA maintained the price in Inorganics with a small increase in Naturals. The sizable decrease of Organics and Polymers was because they are the first- and second-generation products from Crude Oil (decrease of 31%).
That year, the top 125 chemical industries (ICIS – Sep 2020) showed a change in revenue of –4%, reinforced by trading data (TradeMap) numbers of –4% in imports and –3% in exports.
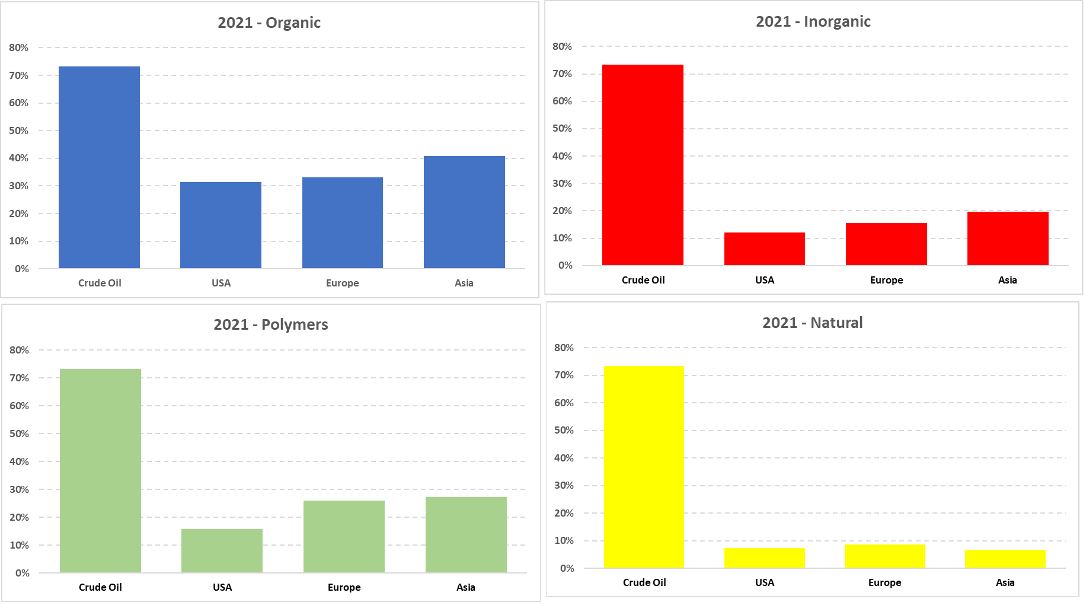
2021 – To complicate matters, January 2021 witnessed a freak freeze in Texas and Louisiana, with snowstorms closing C&P plants for two weeks or more. On top of that, the region experienced four major storms: Tropical Storm Elsa (July), Tropical Storm Fred (August), Hurricane Nicholas (September), and Tropical Storm Ida (August/September), all of which wreaking havoc in plants across the region.
During this time, an extraordinary demand showed up. Understandably, producers were saddled with low inventory, and plants were struggling to ramp up production, with the entire supply chain affected by the same conditions. Correspondingly, prices went up, with sales controls in place and product allocation affected across the board.
The industry saw price increases across all regions and products, with Crude Oil reaching a 70% increase and Natural Gas a 97% increase over 2019. Of course, Organics and Polymers were the most affected, followed by Inorganics and Naturals. That year, the top 125 chemical industries revenue (ICIS -Sep 2021) and trading data (TradeMap) recorded an increase of 28%.
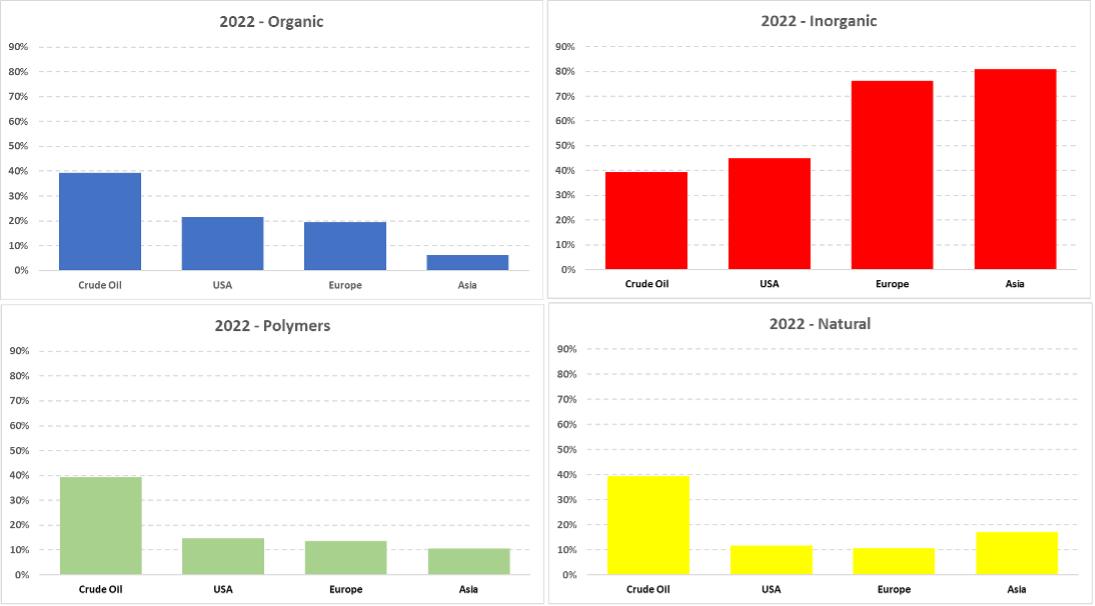
2022 – This year, we experienced few weather changes like in 2021. Exacerbating global commerce, however, were the effects of the war in Ukraine. In addition, demand continued to be high across all regions, still recovering from the 2020 deficit. Because of the war, there was a European embargo on Russian Crude Oil, which, with low supply, saw a price increase around 40% and a Natural Gas increase of 66%, strongly affecting Organics and Polymers. Meanwhile, Inorganics saw a huge increase in Europe and Asia, driven by Fertilizer shortages from Russia.
2023 – Based on the data from CEFIC, ACC, and Accenture, I have created a snapshot of the end-use market in the USA, shown in Chart I below. As there is no global data by end-use market, I am using the USA as a reference to show the diversification of end-use markets.
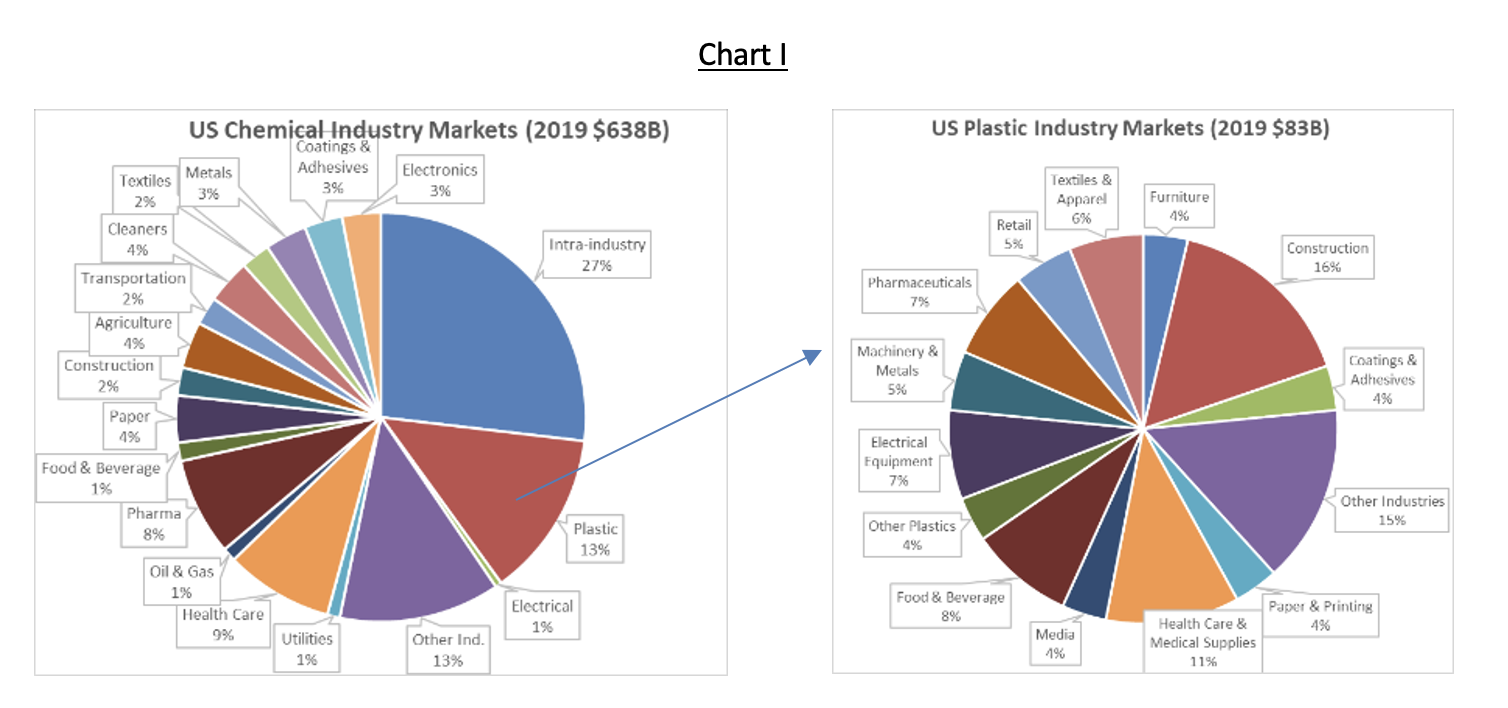
Of note, the Chemical industry has two unique characteristics. First, it has the most diversified end-use markets across all manufacturing industries, and second, its biggest customer is the Chemical industry itself (27%). Consequently, everything happening in C&P will affect all other industries.
To be frank, any forecast is wrong at the moment of publication. However, some indications offer clues for purchasing managers.
- Some economists are saying that 2023 may see recession in several countries due to steeply higher interest rates as a result of inflation-fighting measures. This inflation was partially caused by the C&P in 2021 and 2022 and C&P’s affects across all other industries.
- Analyzing Crude Oil Futures and Options from CME Group, the average Crude Oil price for 2023 should be around $70/BBL; this is supported by a Wall Street Journal analysis showing $75/BBL, both of which are lower than $96/BBL in 2022.
- ICIS (Dec 2022) offers this cautionary note: “Capacity utilization data show that the chemicals sector globally has geared down in the face of current headwinds.”
- JPMorgan’s Purchasing Manager Index (PMI) shows a continuous decline reaching below 50 index points since last September.
Of course, we cannot forecast future weather changes nor how long the Ukraine war may affect the supply chain. However, based on the above factors, I believe we will see a trend of decreased prices in all regions and products, making it an excellent time for purchasing managers to run sourcing projects.
When you subscribe to the blog, we will send you an e-mail when there are new updates on the site so you wouldn't miss them.